Time Series Plots
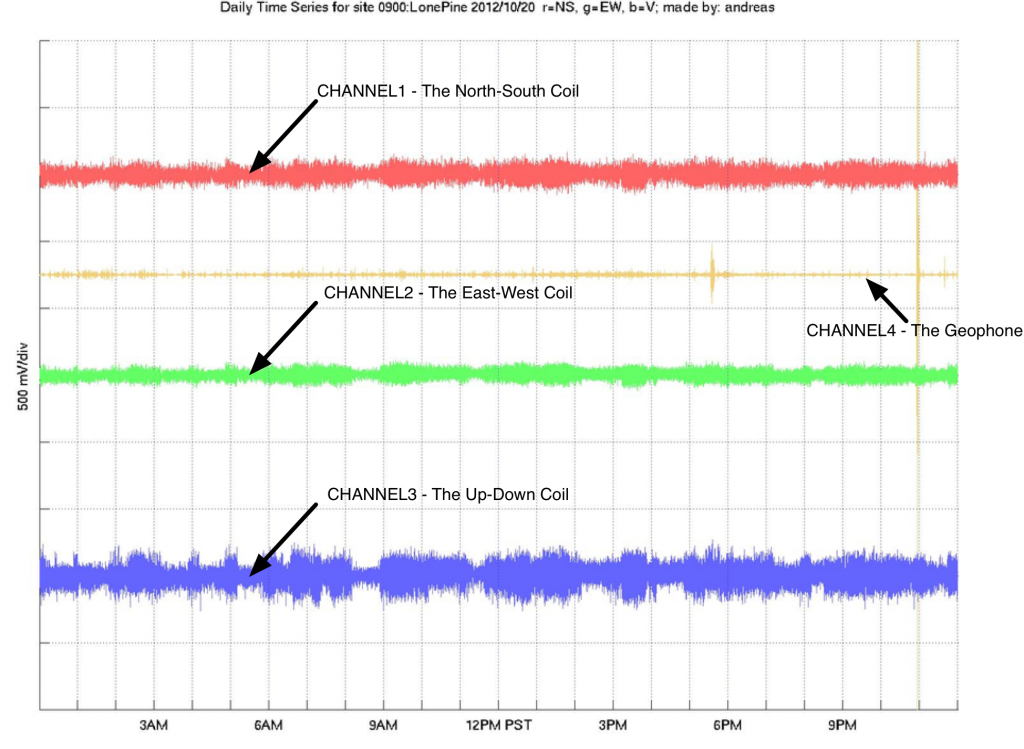
The QuakeFinder Daily Time Series plot shows the three raw magnetometer signals from each site for 24 hours. The plots are all aligned on Pacific Standard Time midnight, which is eight hours behind Greenwich Mean Time. Therefore a plot for March 20, 2013 would span from GMT 2013/03/20 08:00:00 to 2013/03/21 08:00:00 on its horizontal axis. The timestamps on the bottom horizontal axis are in the PST time zone (not daylight savings time).
The vertical axis of the plot is scaled in volts, where each division is 500 millivolts, or 0.5 volts. The signals have been deliberately offset so as not to be drawn on top of each other, therefore no hard voltage values are listed on the left axis.

The vertical axis of the plot is scaled in volts, where each division is 500 millivolts, or 0.5 volts. The signals have been deliberately offset so as not to be drawn on top of each other, therefore no hard voltage values are listed on the left axis.

Plot trace colors are listed in the order of a computer monitor for easy remembering. Channels 1/2/3 = R/G/B. The Y-axis is 500mv/division (scaled to show some detail in the trace). 1 Volt represents approximately 1 nT (1000pT). The gold trace shows the geophone signal, and often a large shaking from a car or an earthquake will be accompanied by signals in the magnetometers.
Sometimes there are gaps in the data, caused by a reboot, power outage, etc. These are seen as thin straight lines and the absence of signal.
